
We’re thrilled to announce the launch of the Occulights Data Dashboard—giving workplace and facility teams a powerful new way to visualize real-time insights from their meeting spaces.
With just a glance, you’ll now be able to answer key questions like:
-
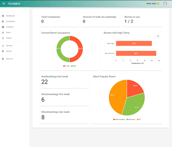
Which rooms are used the most or least?
-
How many ghost meetings have been automatically avoided?
-
How many meetings were auto-booked by the Occuhub sensor?
-
Which rooms have the best or worst temperature and humidity?
Why This Matters
Data is key to smarter space planning. With the new dashboard, Occulights transforms live room activity and indoor climate metrics into clear, actionable visuals—helping you optimize your office layout, improve employee comfort, and increase ROI.
Whether you're running a handful of drop-in rooms or managing dozens across multiple floors, the dashboard gives you instant clarity on how your spaces are actually being used.
Key Metrics Included
✅ Room Utilization Leaderboard – See which rooms are most and least used over time
✅ Ghost Meetings Avoided – Track how many empty bookings were automatically released
✅ Auto-Bookings Generated – Measure employee adoption of walk-in meetings
✅ Climate Overview – Identify rooms with poor temperature or humidity, and improve indoor comfort
Built for Simplicity
No need for complex BI tools or integrations. The dashboard is included in your Occulights subscription and can be accessed directly from your admin portal.
This is the kind of transparency workplace and facility teams have been waiting for—without the cost or complexity of traditional systems.
Available from August.